
- Client
- Wild Brains, now Atlas
- Role
- Lead designer
- Stage
- Seed round
- Platform
- iOS
Built from the original anatomical view. The motion is illustrative, not measured brain activity.
Summary
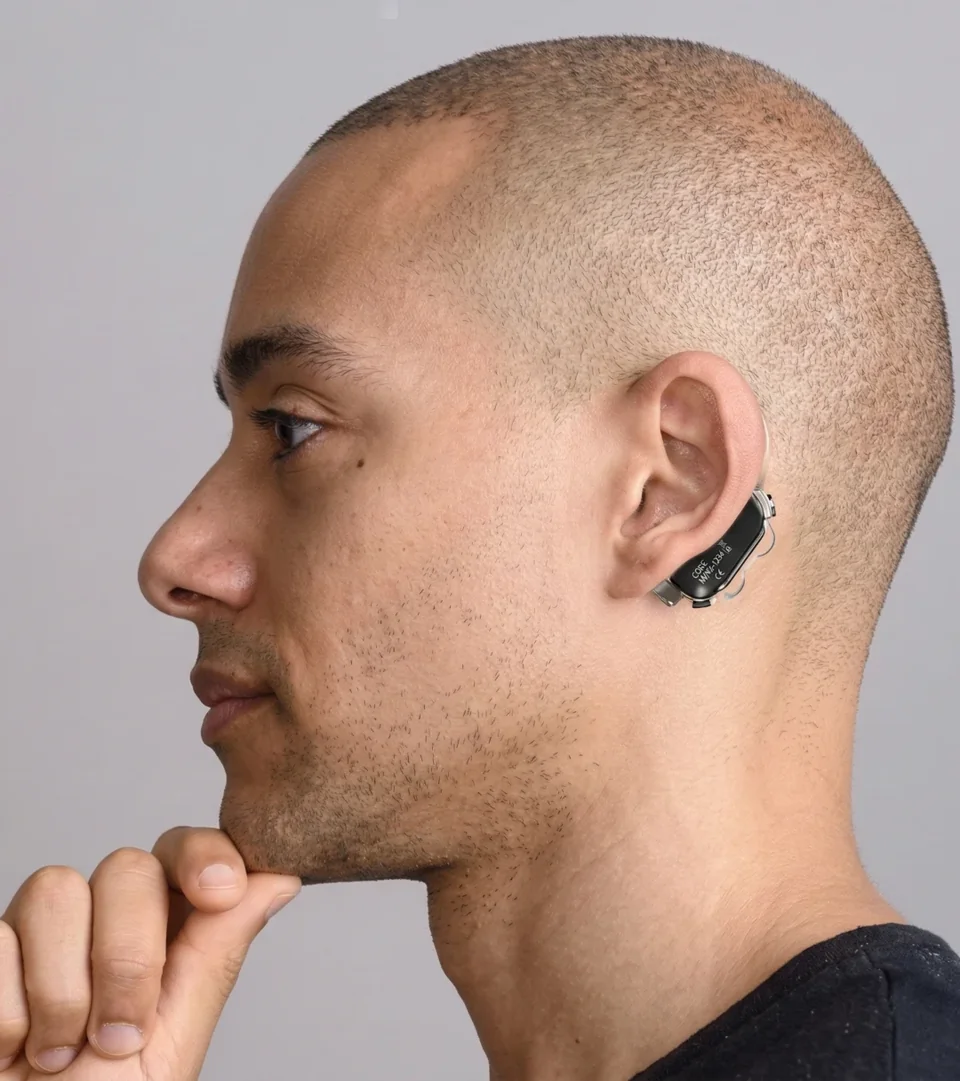
A wearable that reads your brain, and an app that trains it.
Lead designer from discovery through definition: the initial UX and research, the original UI and the investor pitch deck, working directly with the founder and a small engineering team.
Outcome and scope
Seed round, which the research, UI and pitch deck I designed helped secure
Screens designed end to end, from onboarding to daily activities
Brain metric dimensions defined for the app
Discovery through definition
From the first questions to a product investors could see.
- Listen
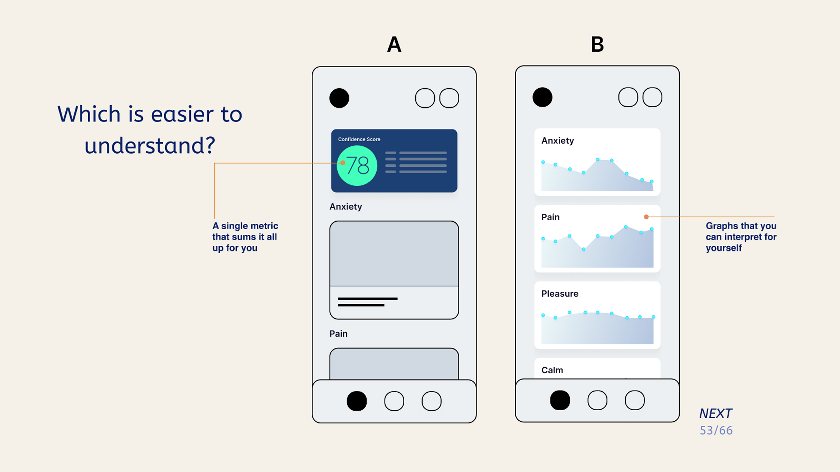
Generative interviews
Stimuli put choices in front of people: a single metric that sums it all up, or graphs you can interpret for yourself. Would you post a score like this online?
- Imagine
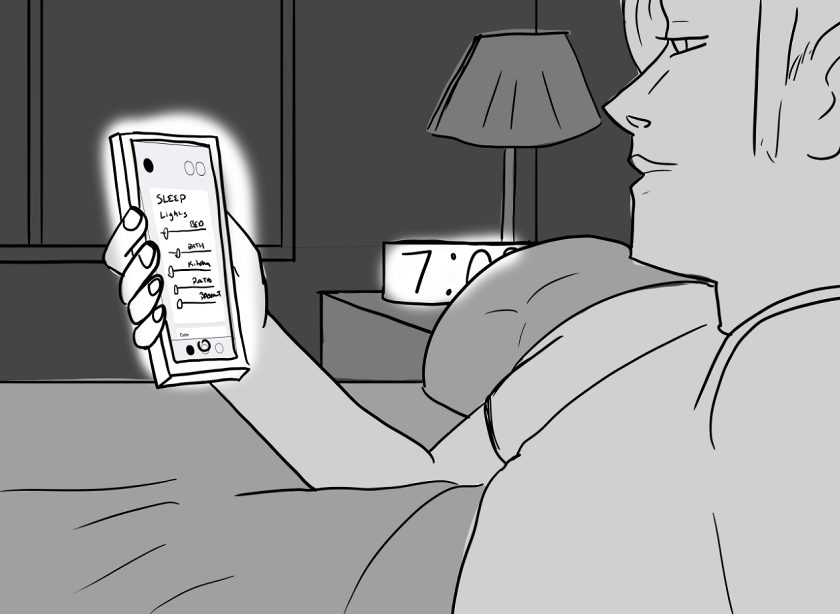
My storyboards
Brian, the quantified self, wants to become “the best possible version of himself.” His storyboard follows him before, during and after the headband: a friend’s video, the device arriving, a daily track, a beta test team.
- Map
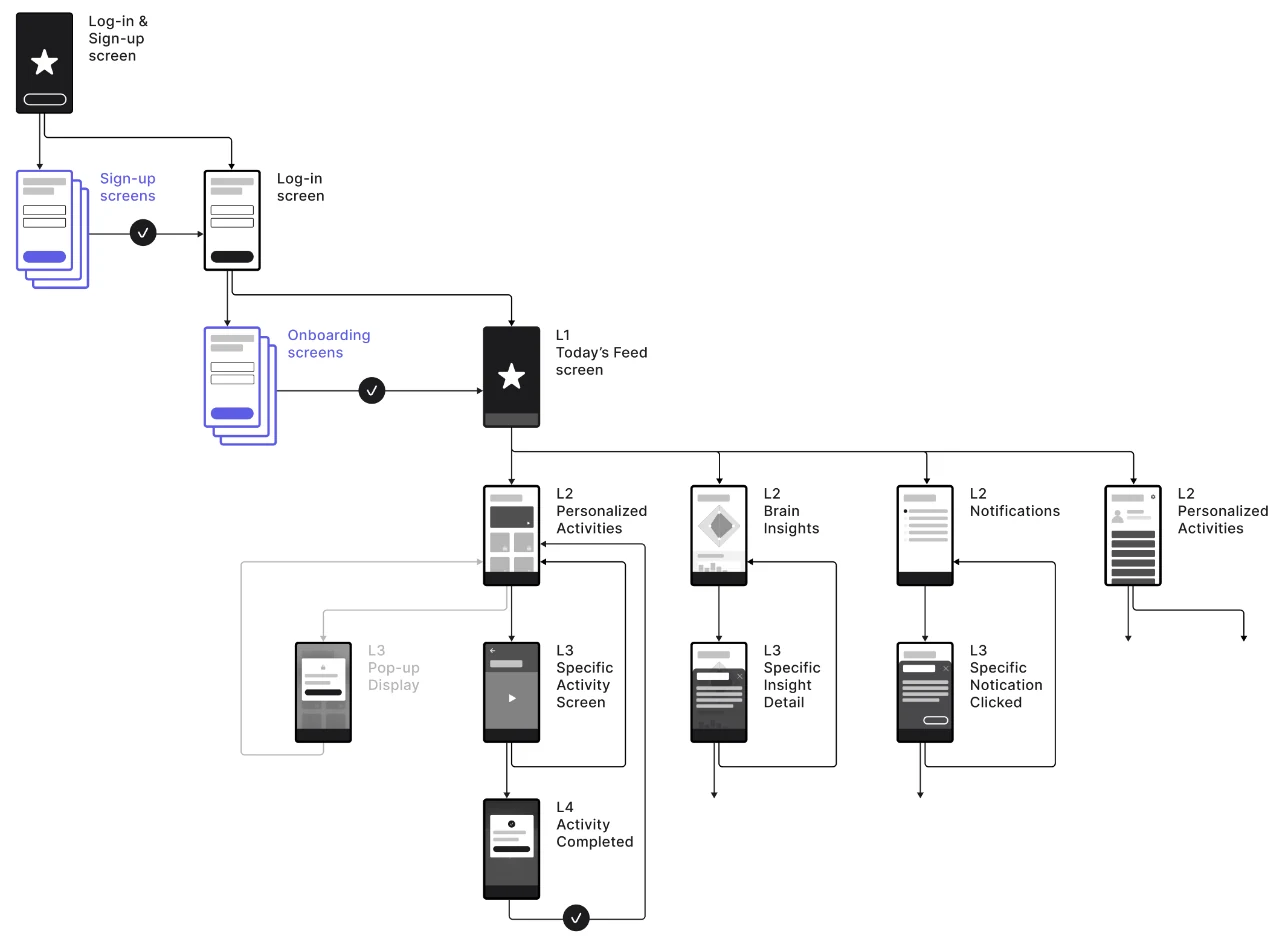
A site map
Today’s feed at the center. Personalized activities, brain insights and notifications one level down, and every completed activity leading back to personalized activities.
- Connect
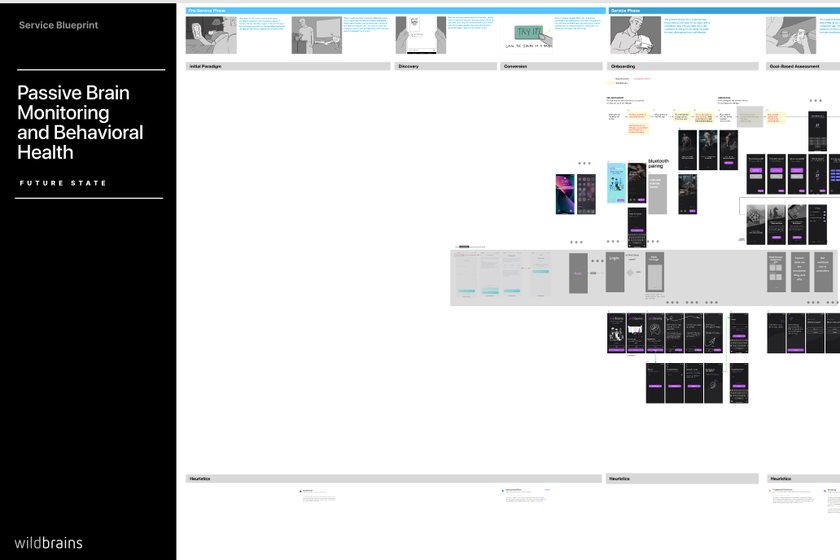
A service blueprint
Passive brain monitoring and behavioral health, future state: the storyboard’s moments lined up against the screens they need, from discovery and conversion to onboarding, assessment and continuous monitoring.
- Pitch
The investor deck
Research, the original UI and the pitch deck I designed put a concrete product in front of investors.
What we learned
More than a better score.
- 01
What would you want to understand?
Interviews explored anxiety, everyday triggers, joy and personal goals. The person’s context came before the metric.
- 02
A number, a pattern, or guidance?
A single score, detailed graphs, or language that could guide an action: different ways to understand progress.
- 03
What is worth sharing?
A high score, better focus, or improving sleep. The contrast helped us look past performance for its own sake.
The flow
From a first goal to a daily path, in five phases.
The phases are the original flow’s own. A new user sets a goal and answers questions; a returning user logs straight in to the daily path.
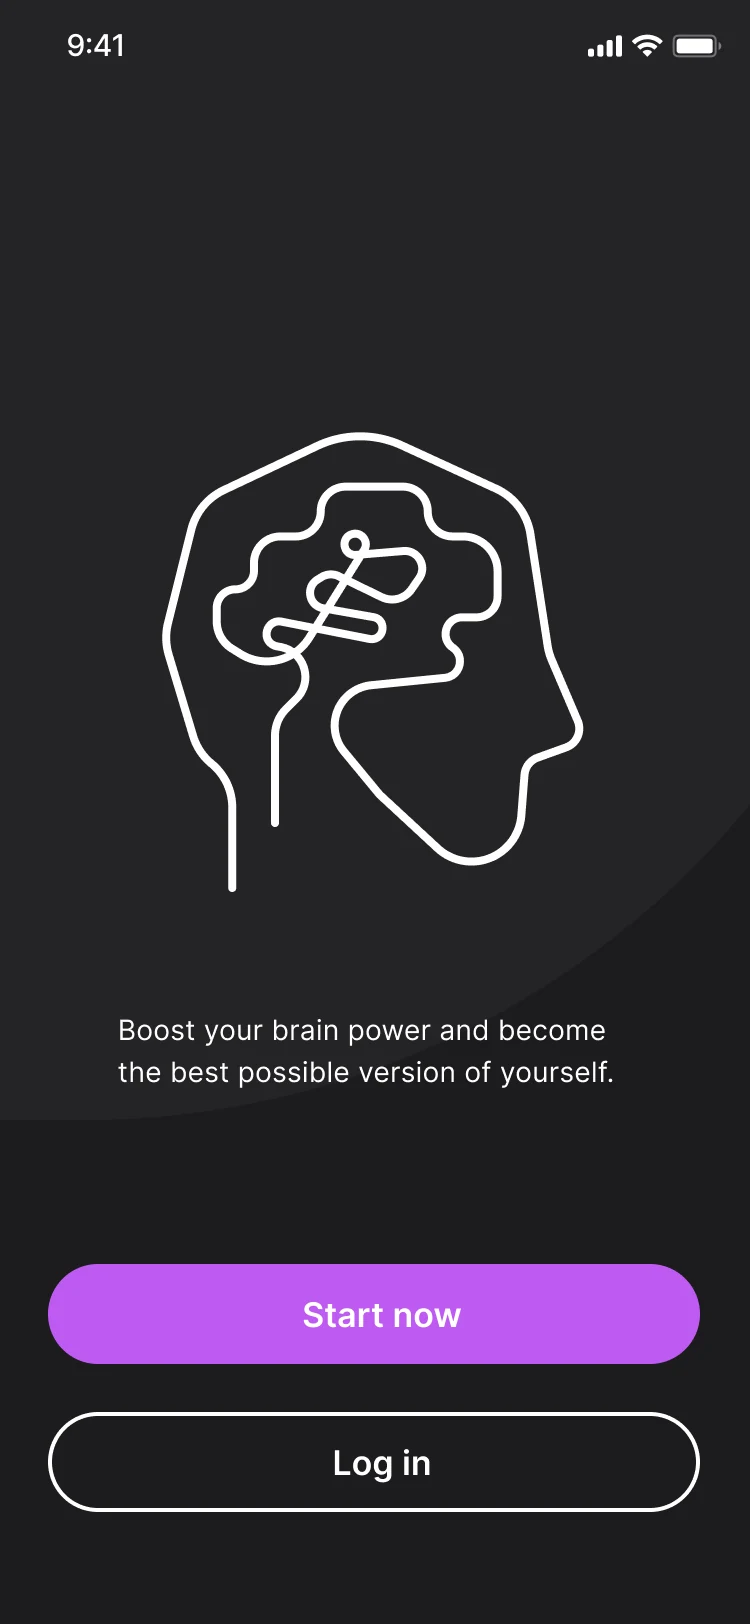 Introduction
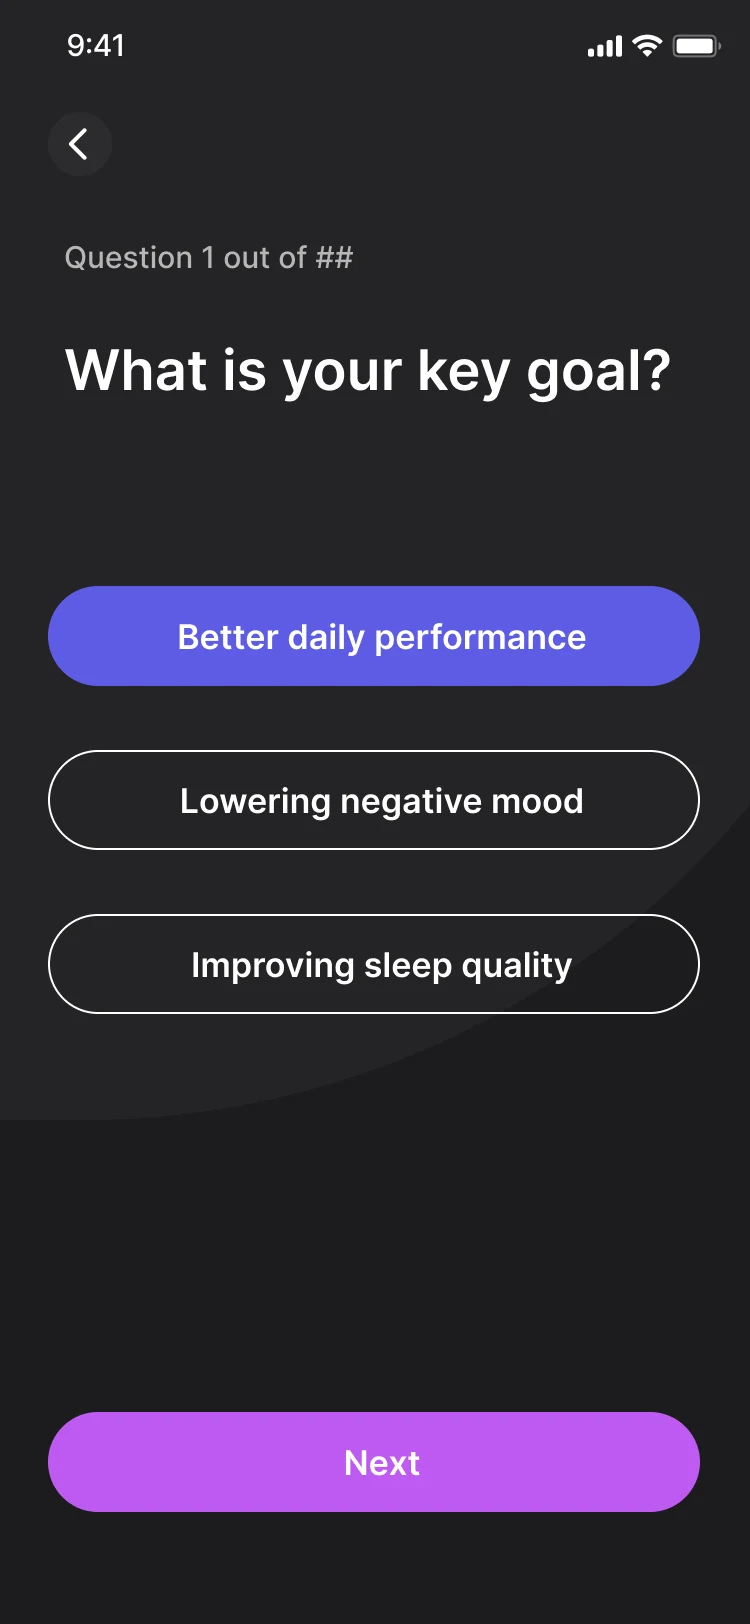 Primary goal
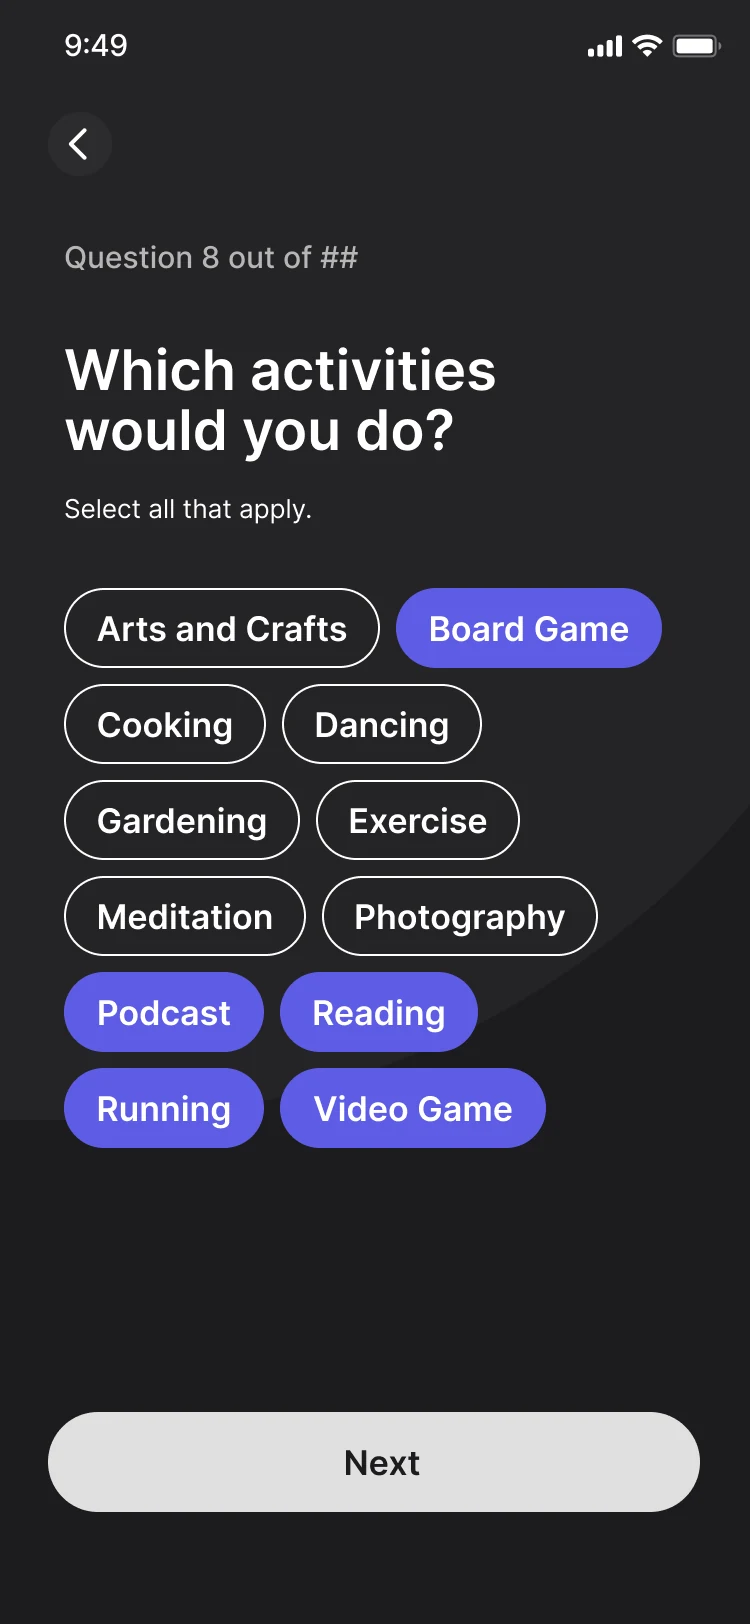 Activities
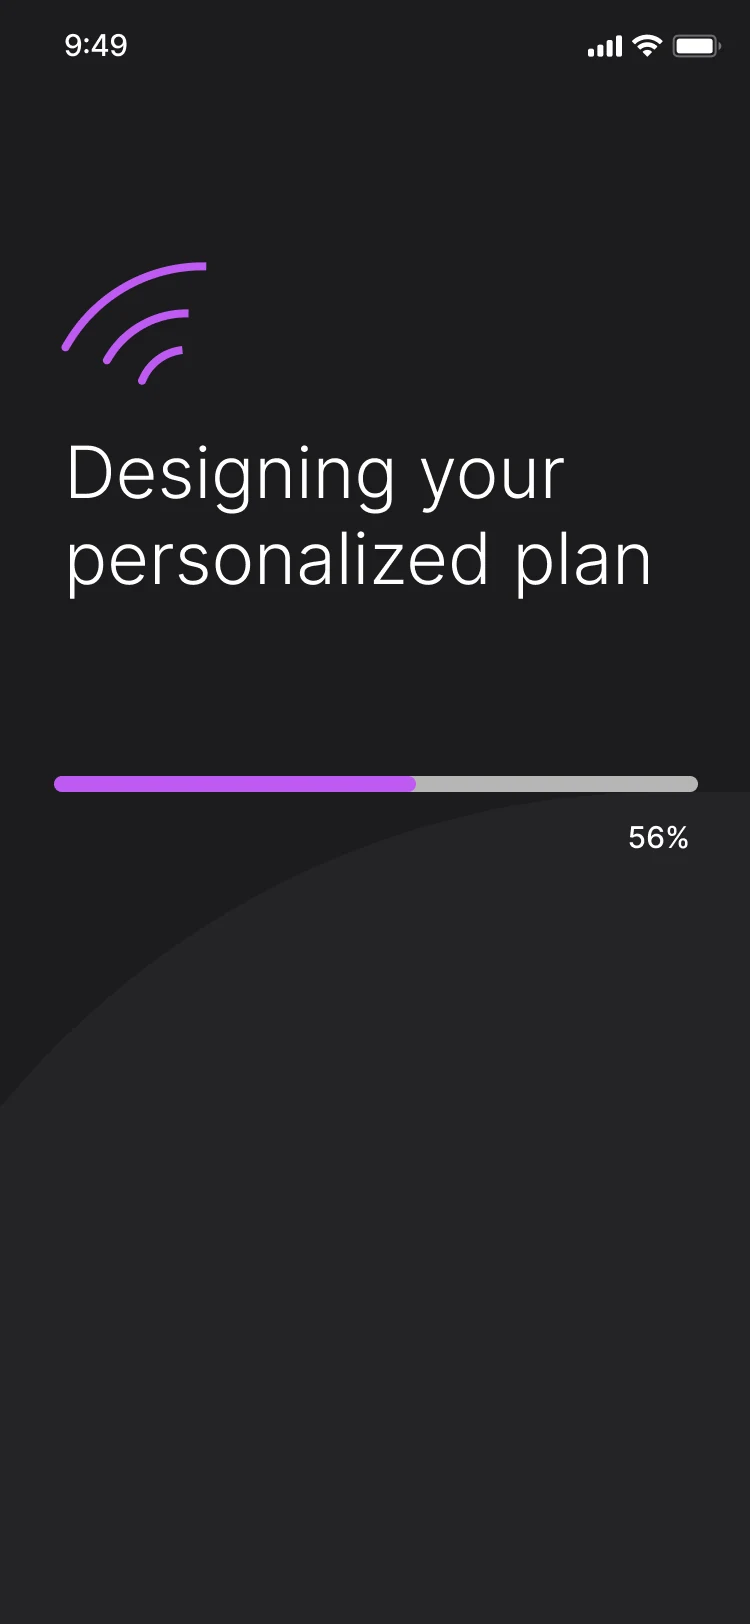 Your plan
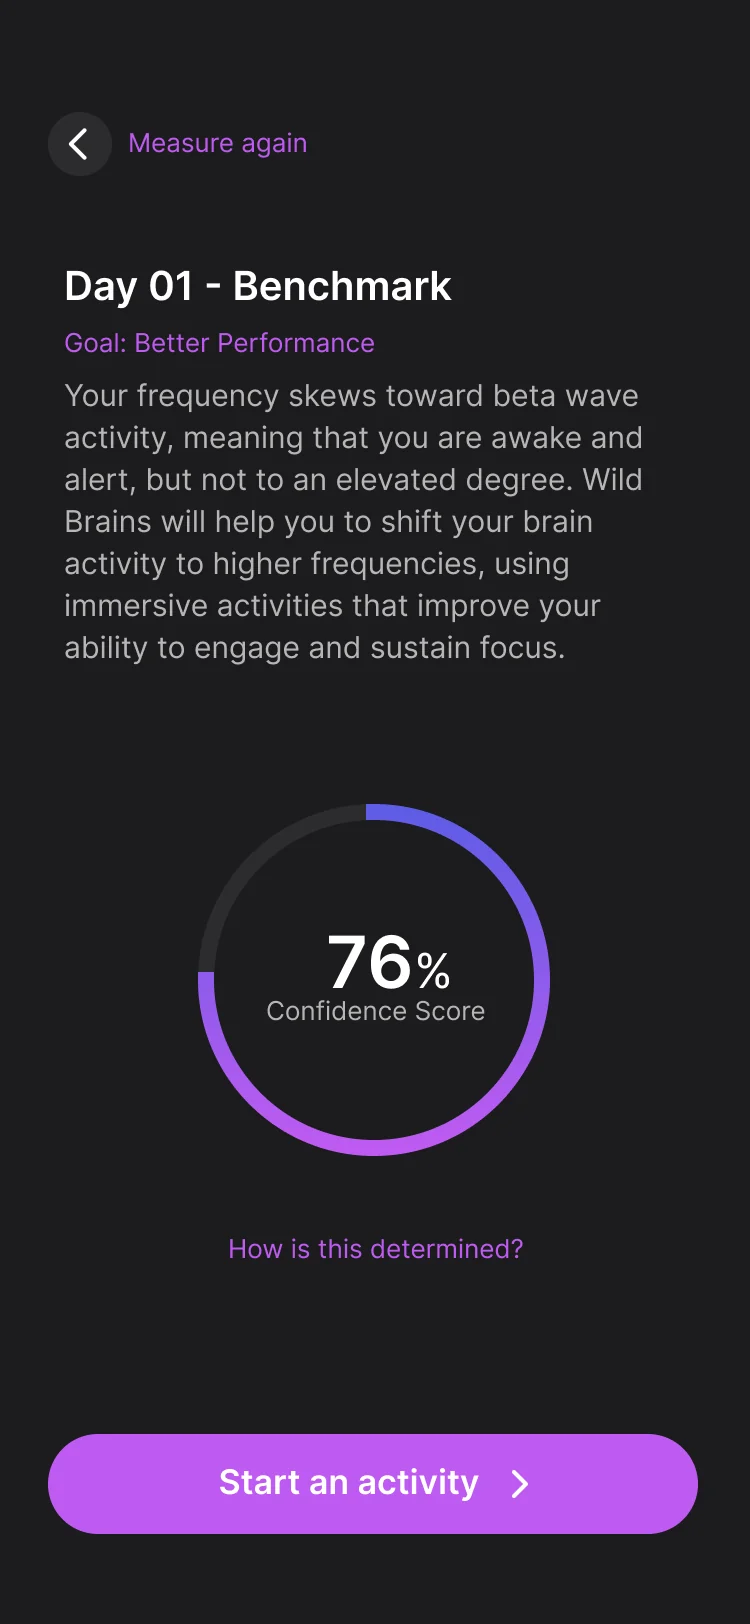 Benchmark
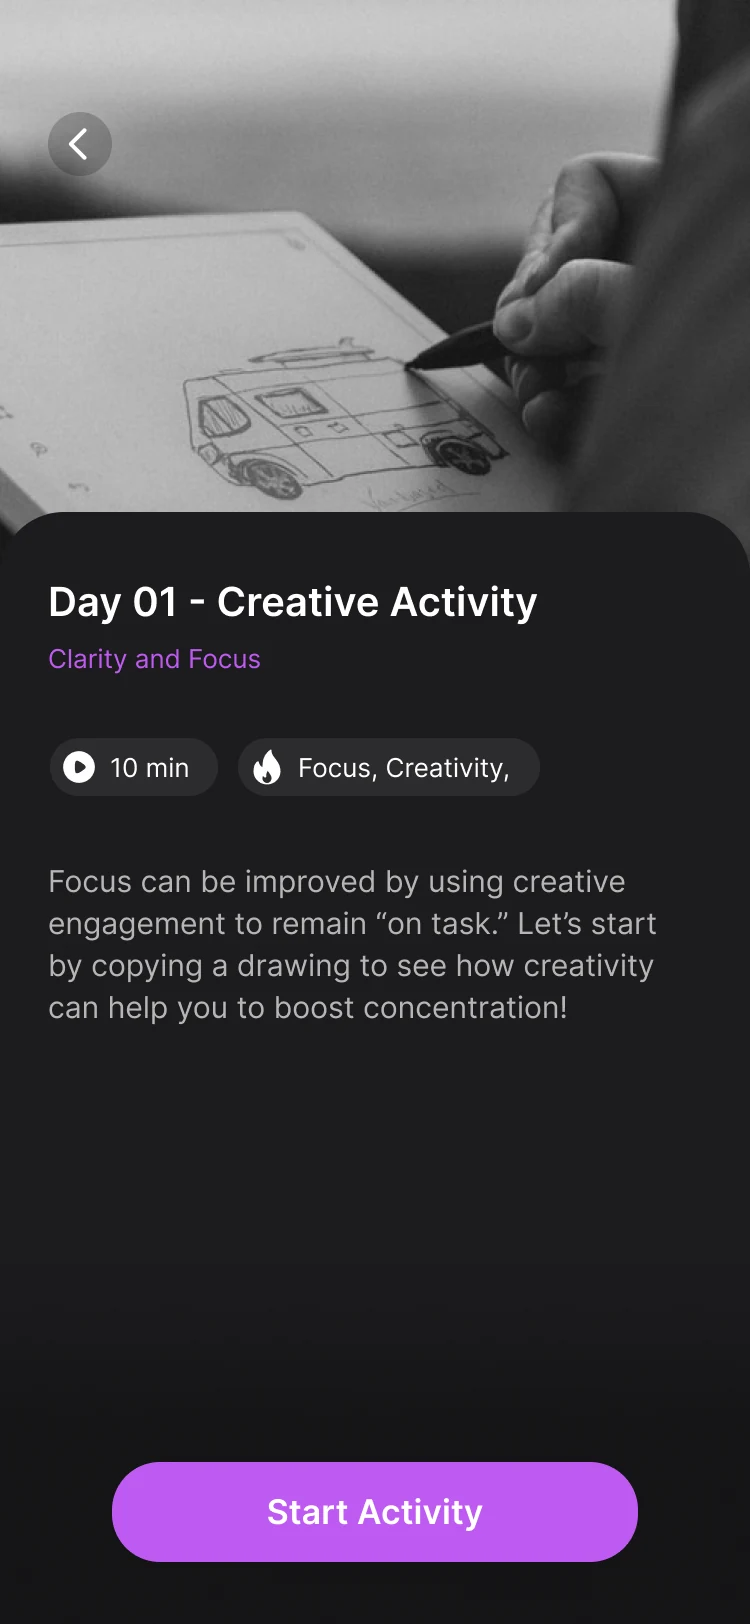 Daily activity
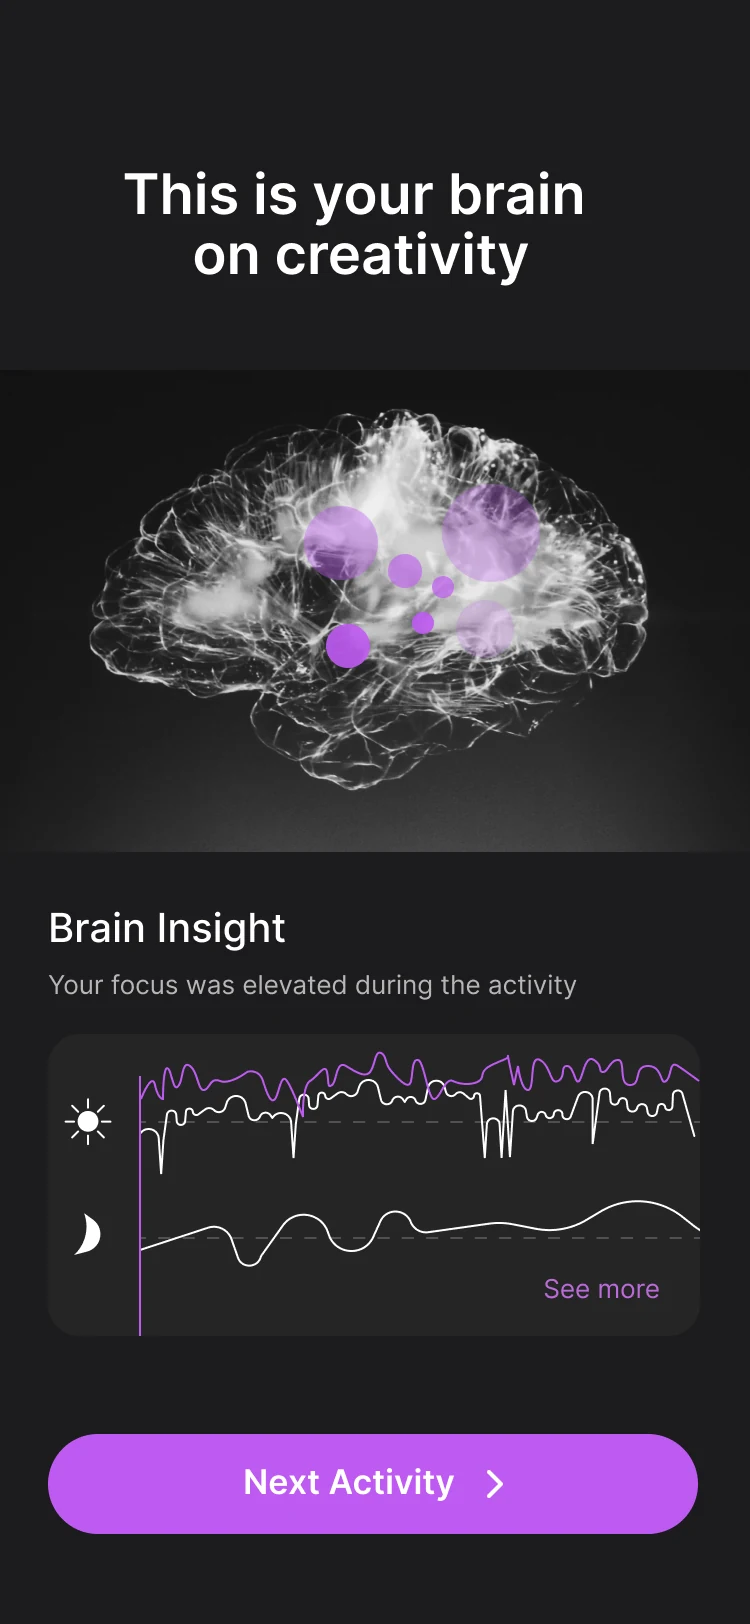 Brain on creativity
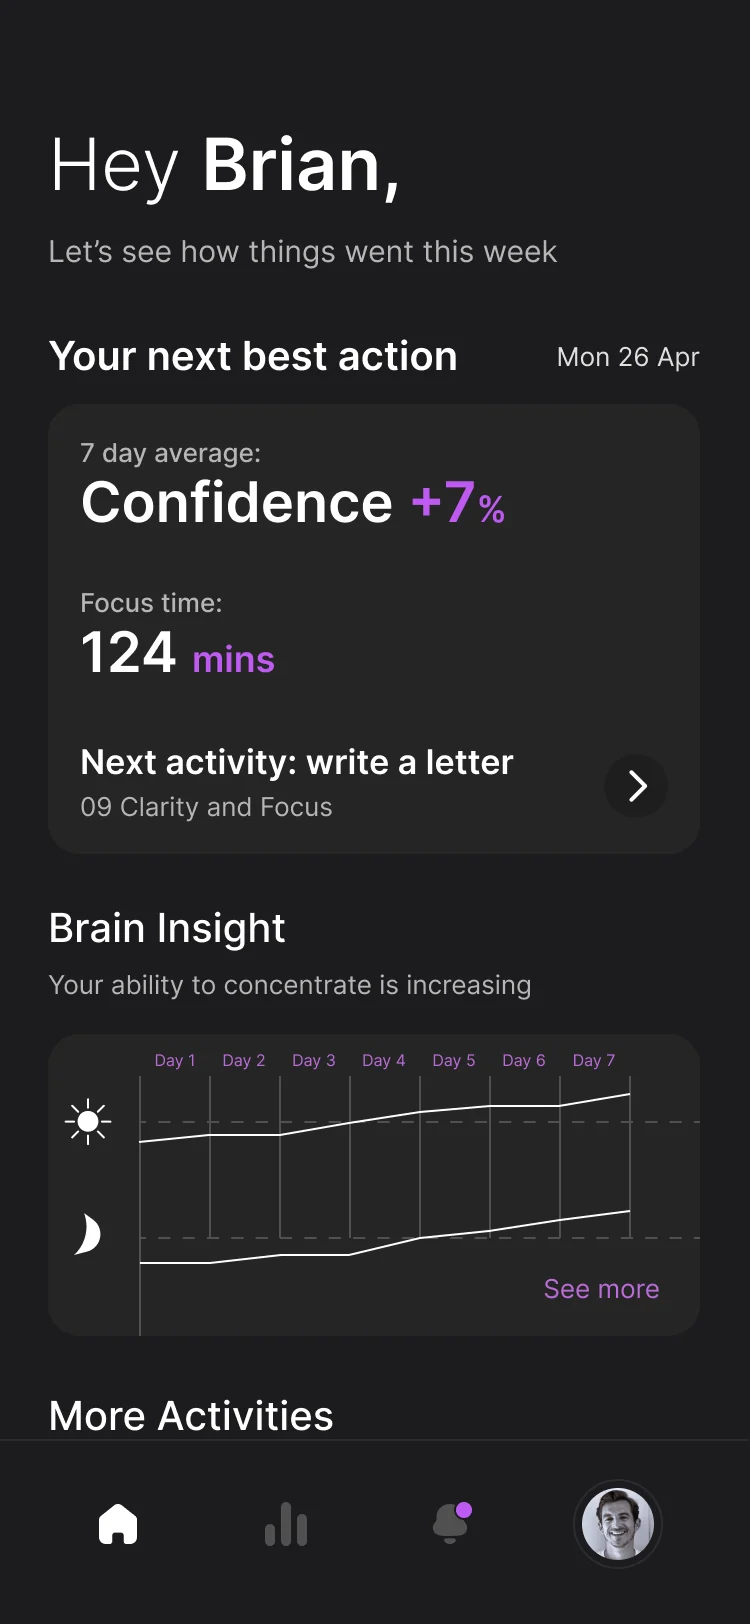 Daily dashboard
Condensed from the original Simplified Flow in Figma. Every screen is an original export; the tags are the buttons that move a person on.
Your brain
Turning neural signals into something you can feel.
The core design challenge: how do you make brain data legible to someone who isn’t a neuroscientist?
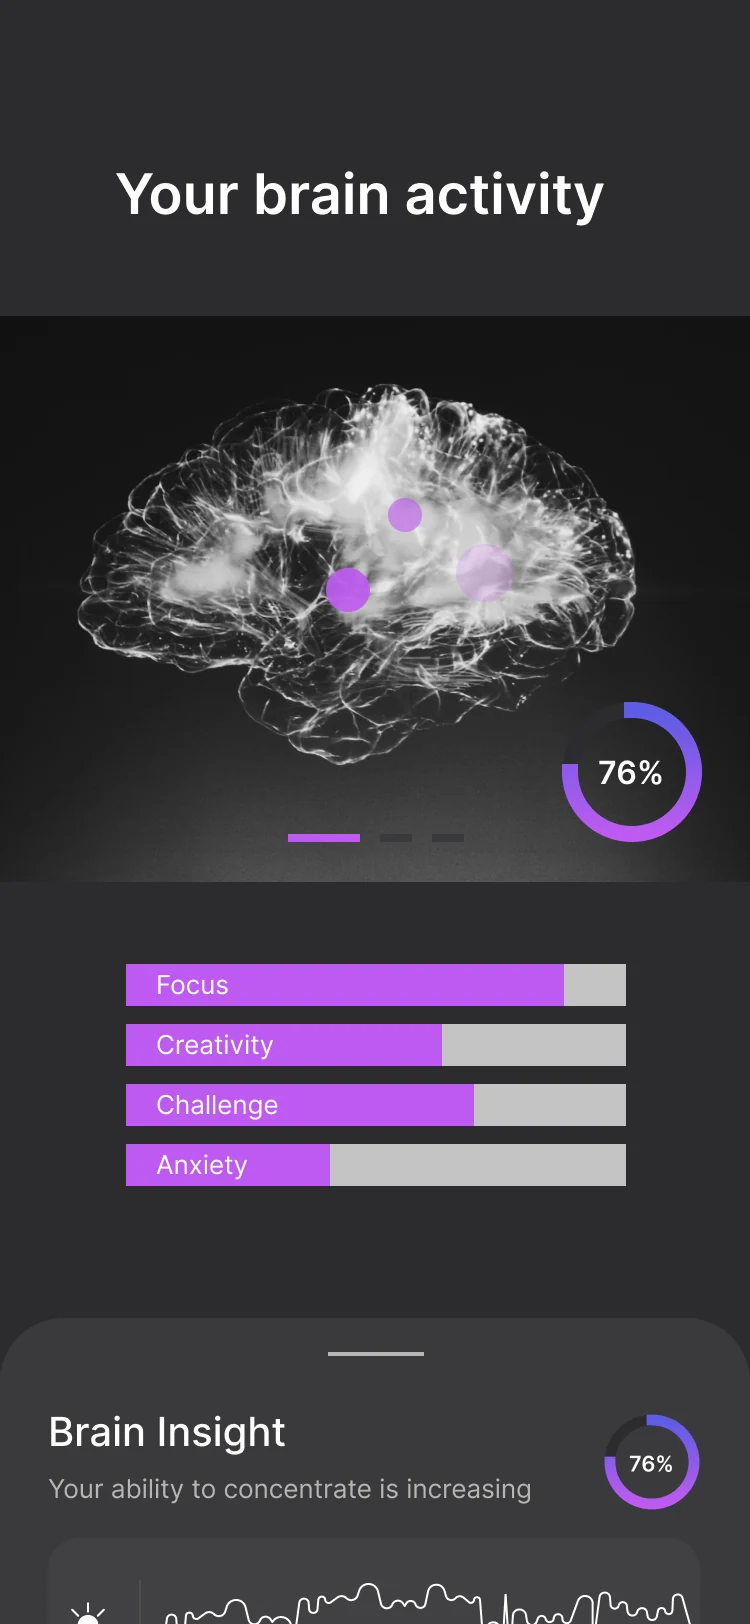
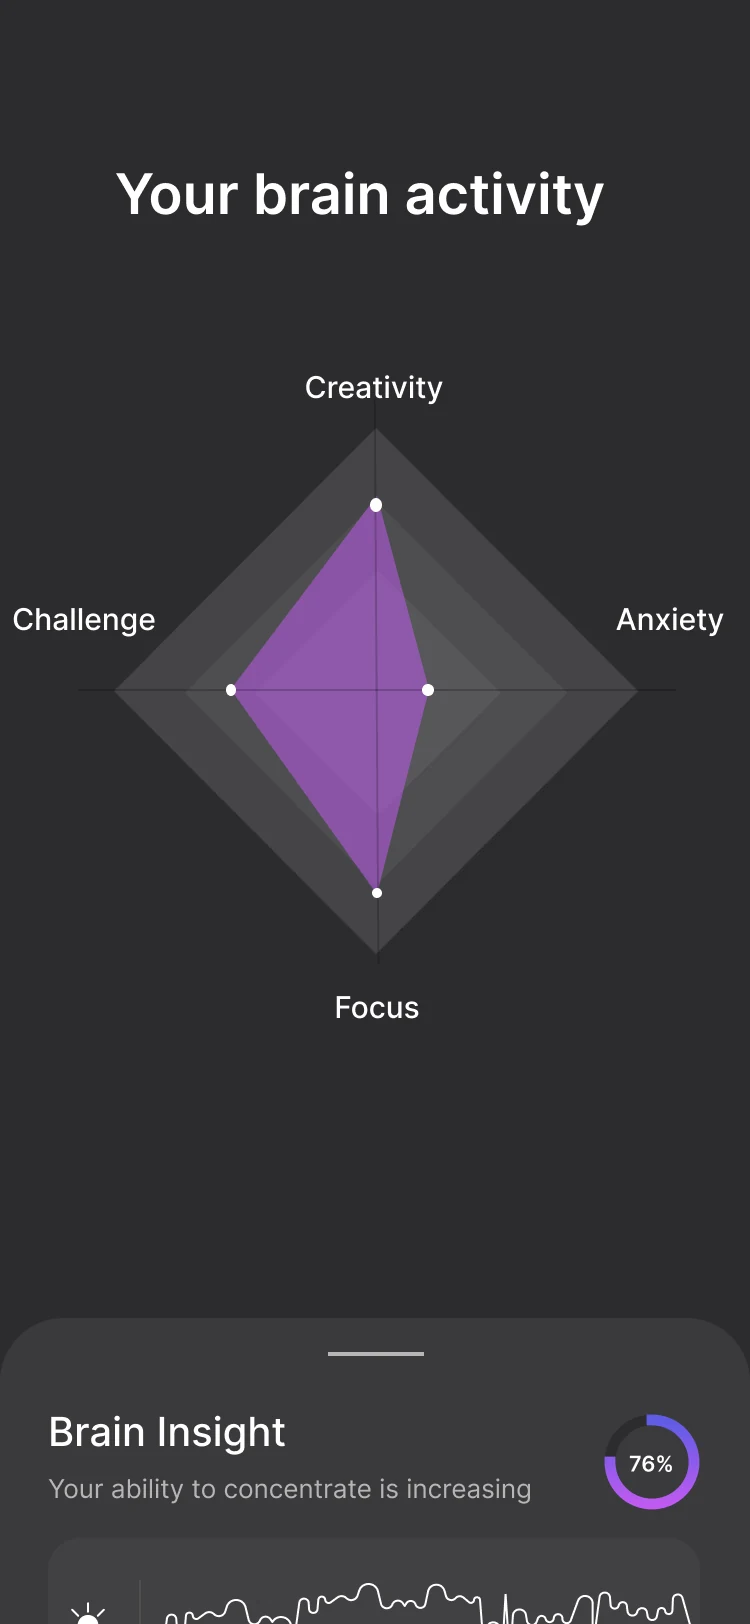
The radar chart works for an at-a-glance profile, the 3D rendering creates an emotional connection, and bars support comparison across sessions.
Inside the original app
Original screens from the iOS app. The tour plays on its own; tap the phone to take over.
The assessment asks about goals, daily rhythms, self-perception and activities someone enjoys, so the plan has a reason to be personal.
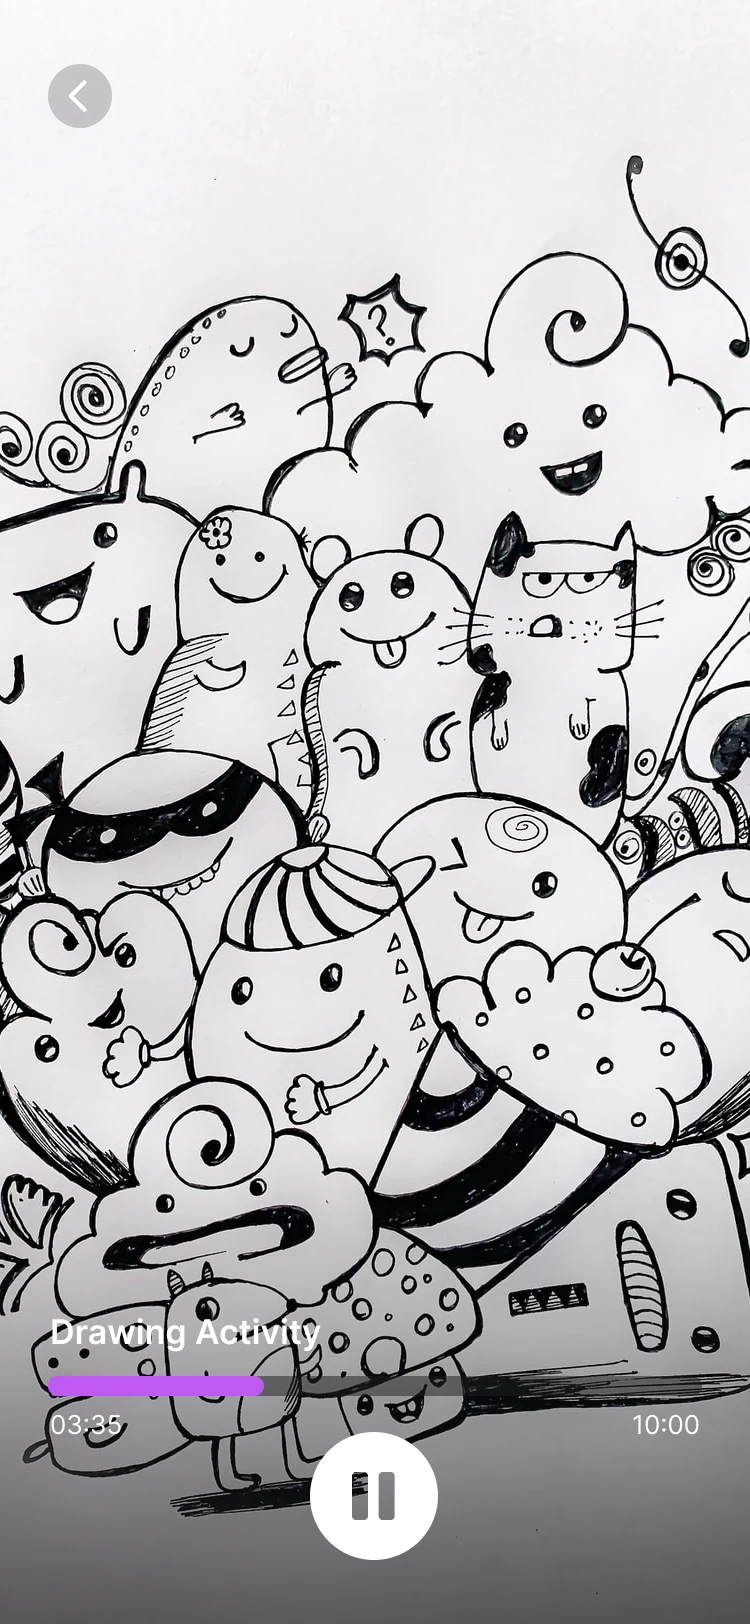
A creative challenge gives the product a purpose beyond monitoring, then returns feedback in the context of what you just did.
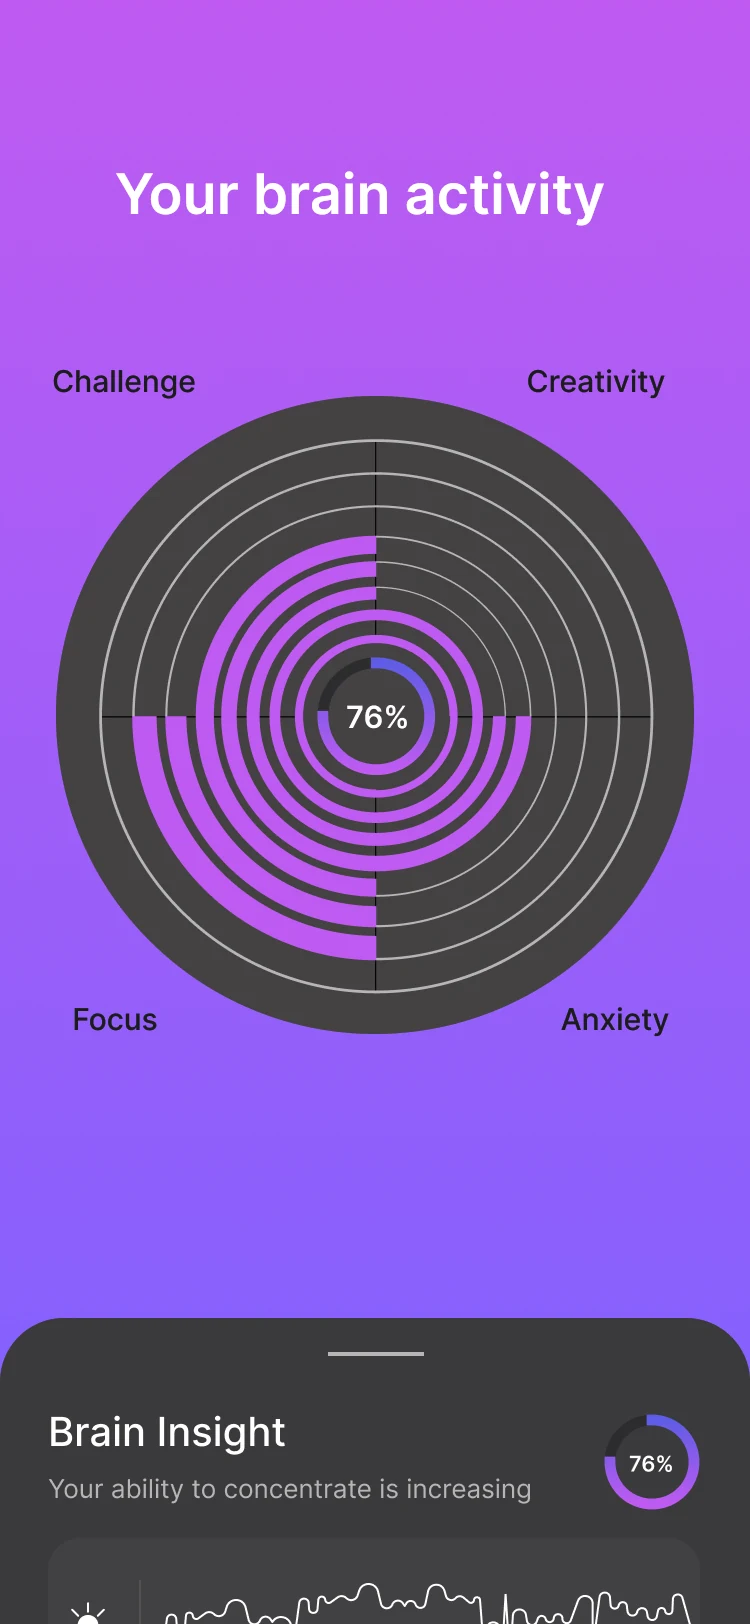
Original explorations, not a sequence: an anatomical view with a bar for each dimension, a radar of the dimensions together, and a compact overview.
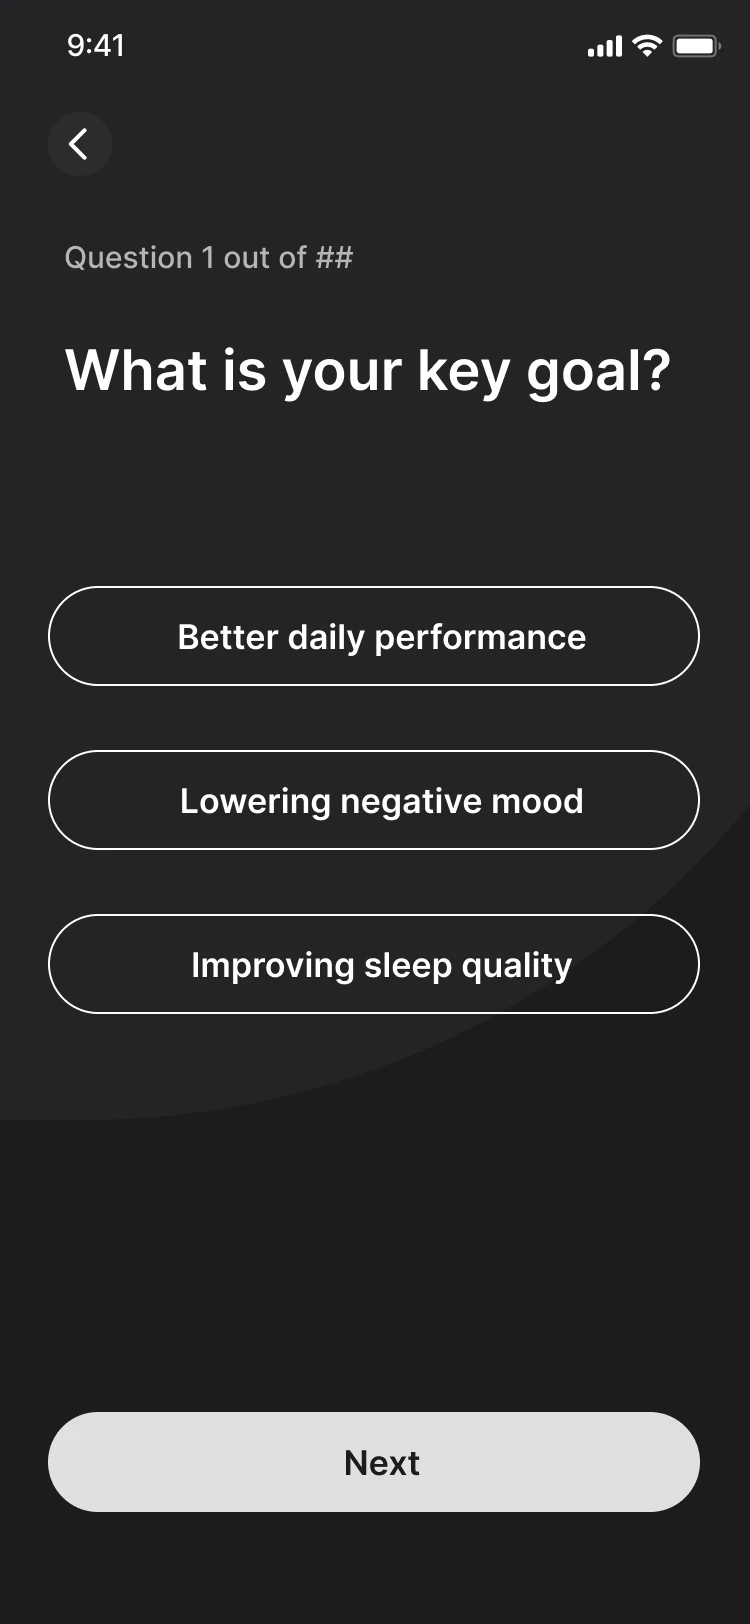
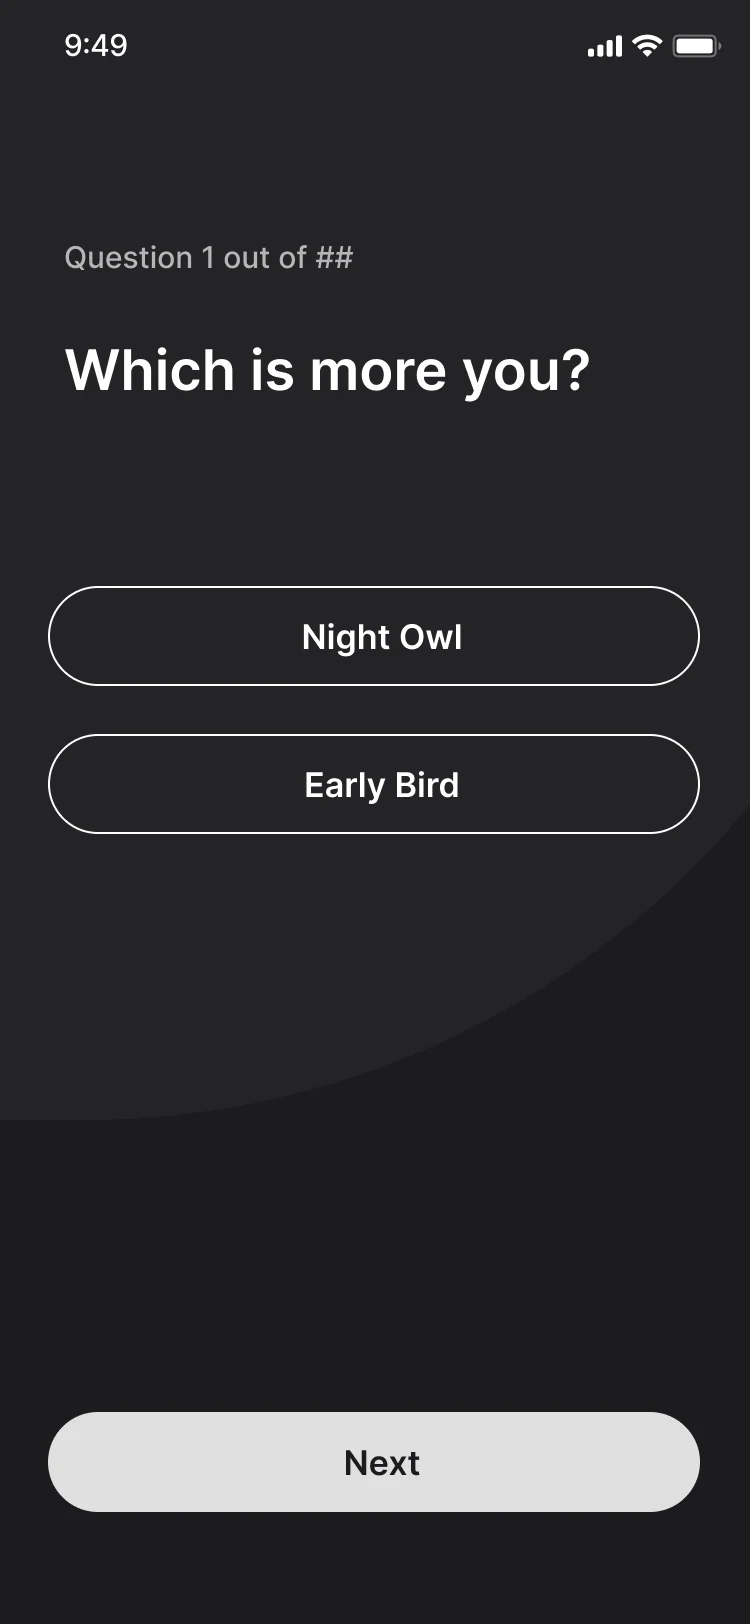
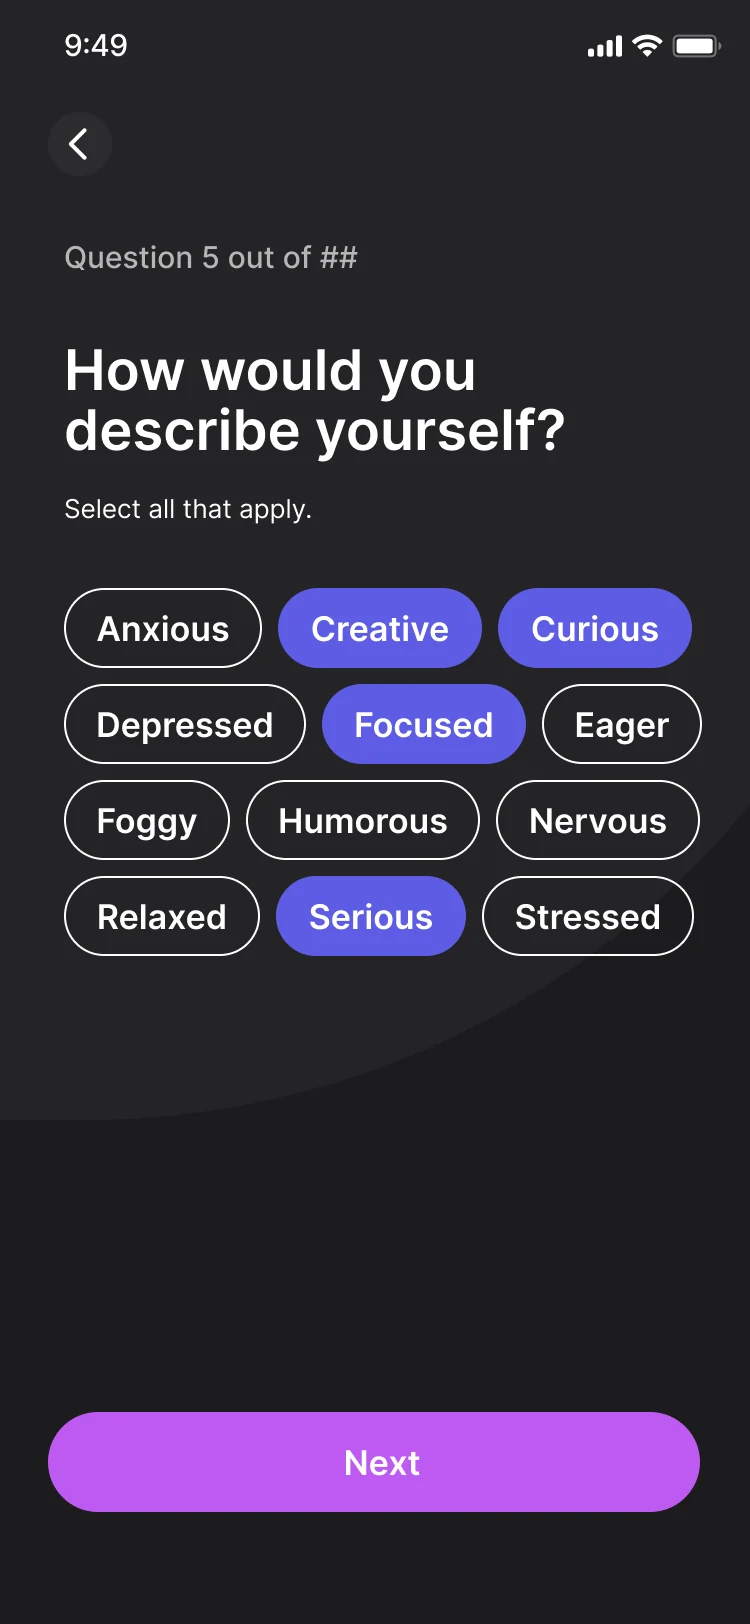
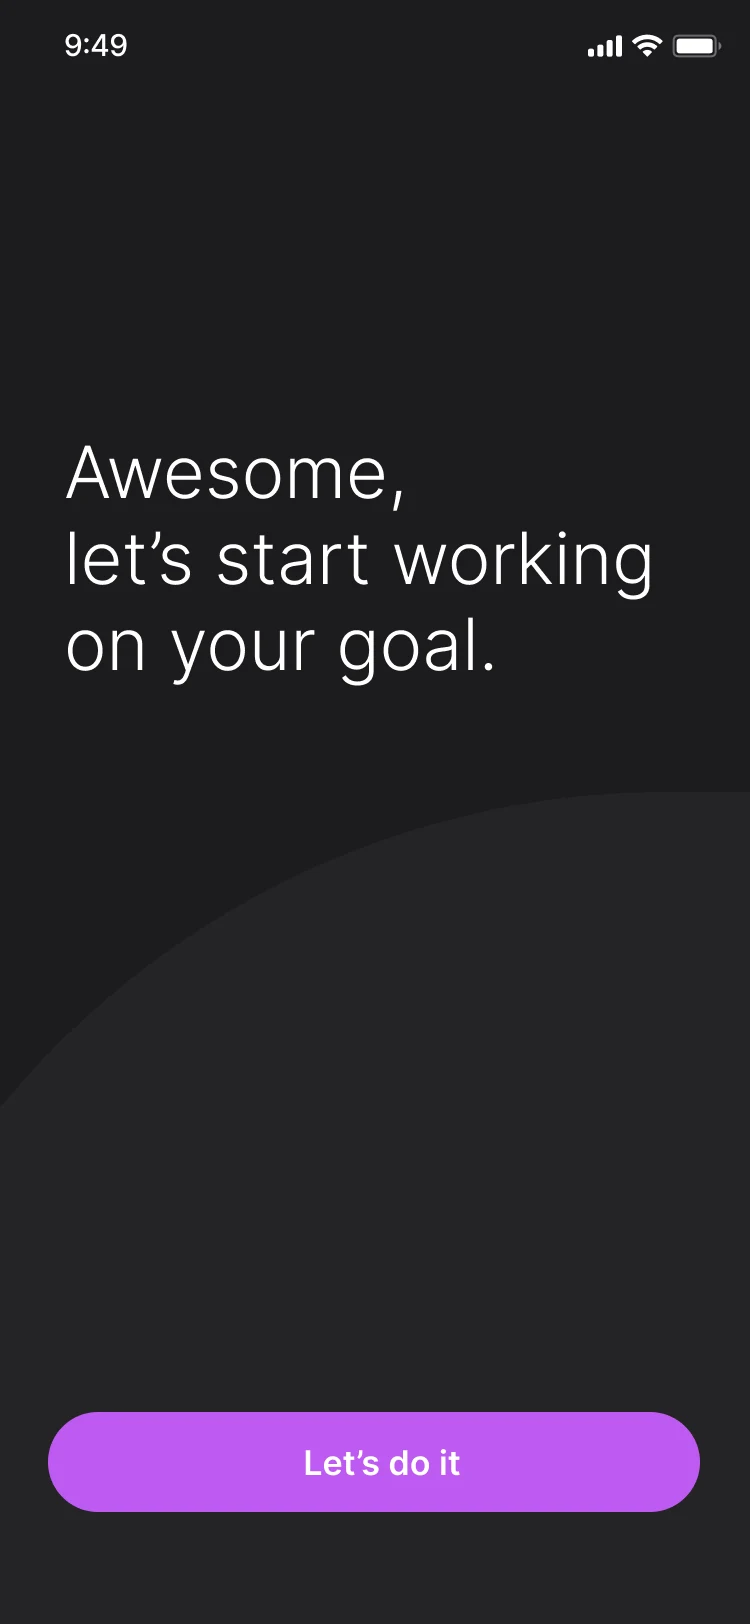
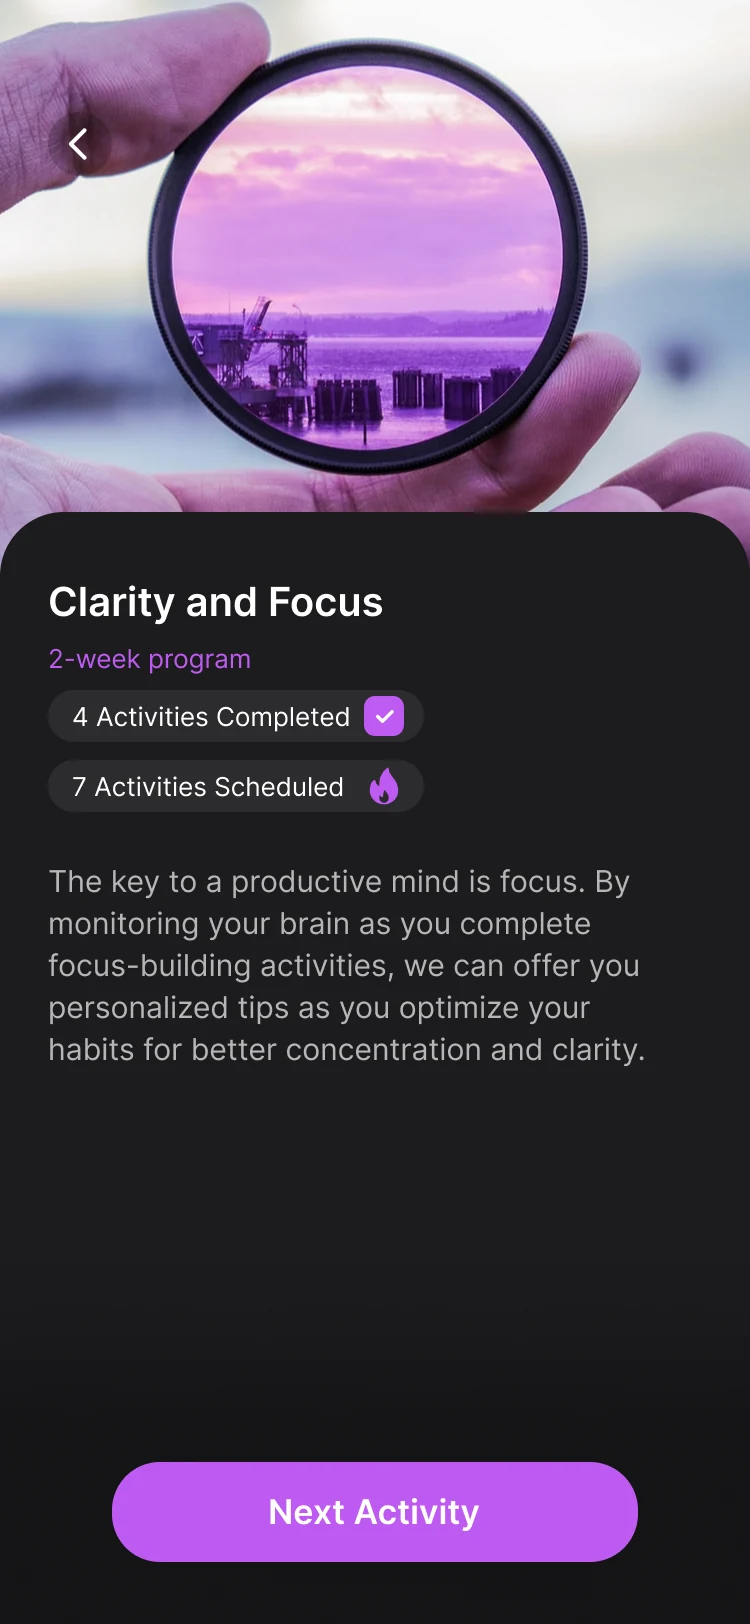
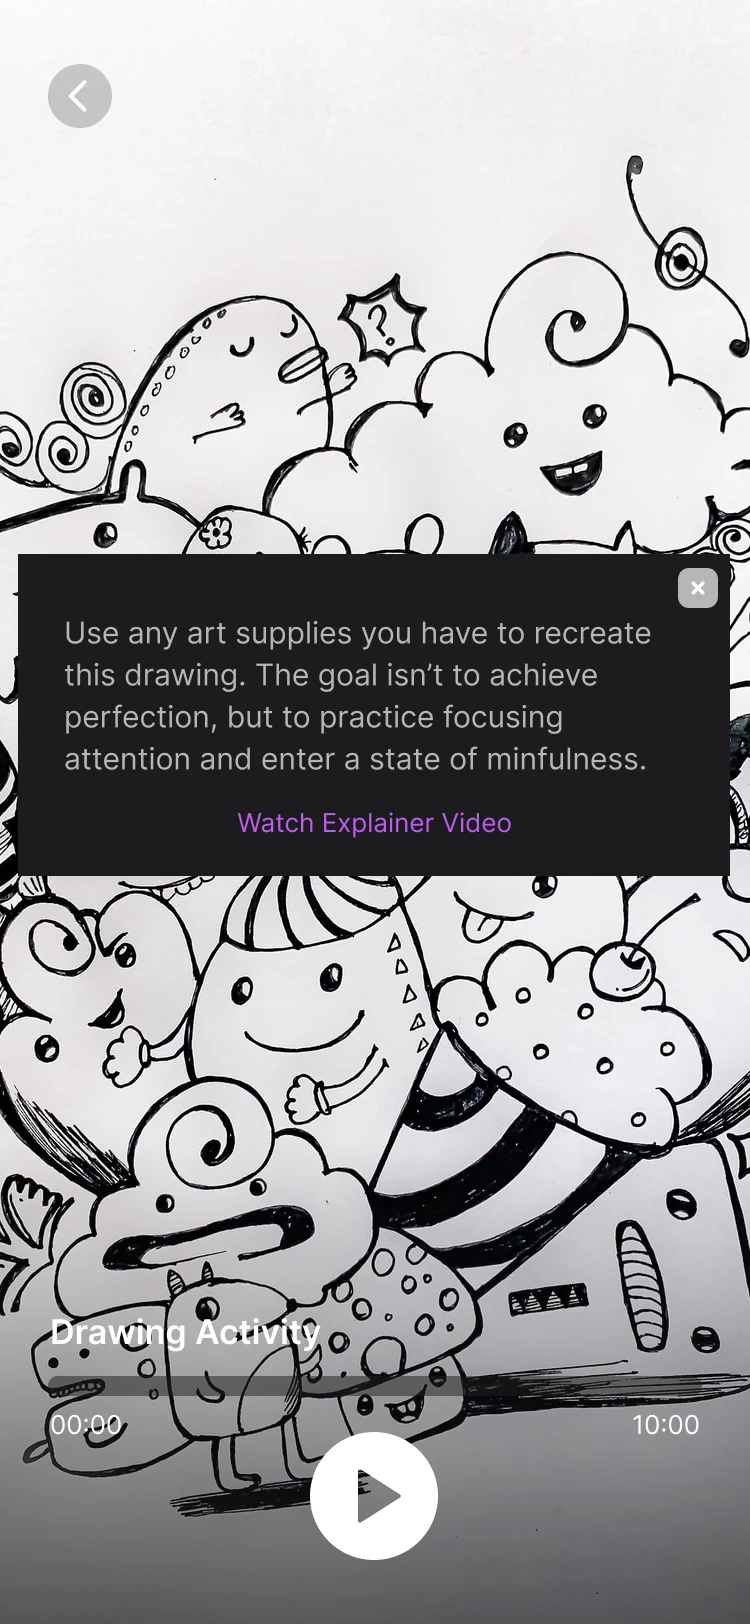
A simple invitation
Outcome
It wasn’t just a device. It was a daily habit.
The work that
became Atlas.
The research, original UI and pitch deck I designed helped secure the seed round. The company went on to launch as Atlas in 2026.
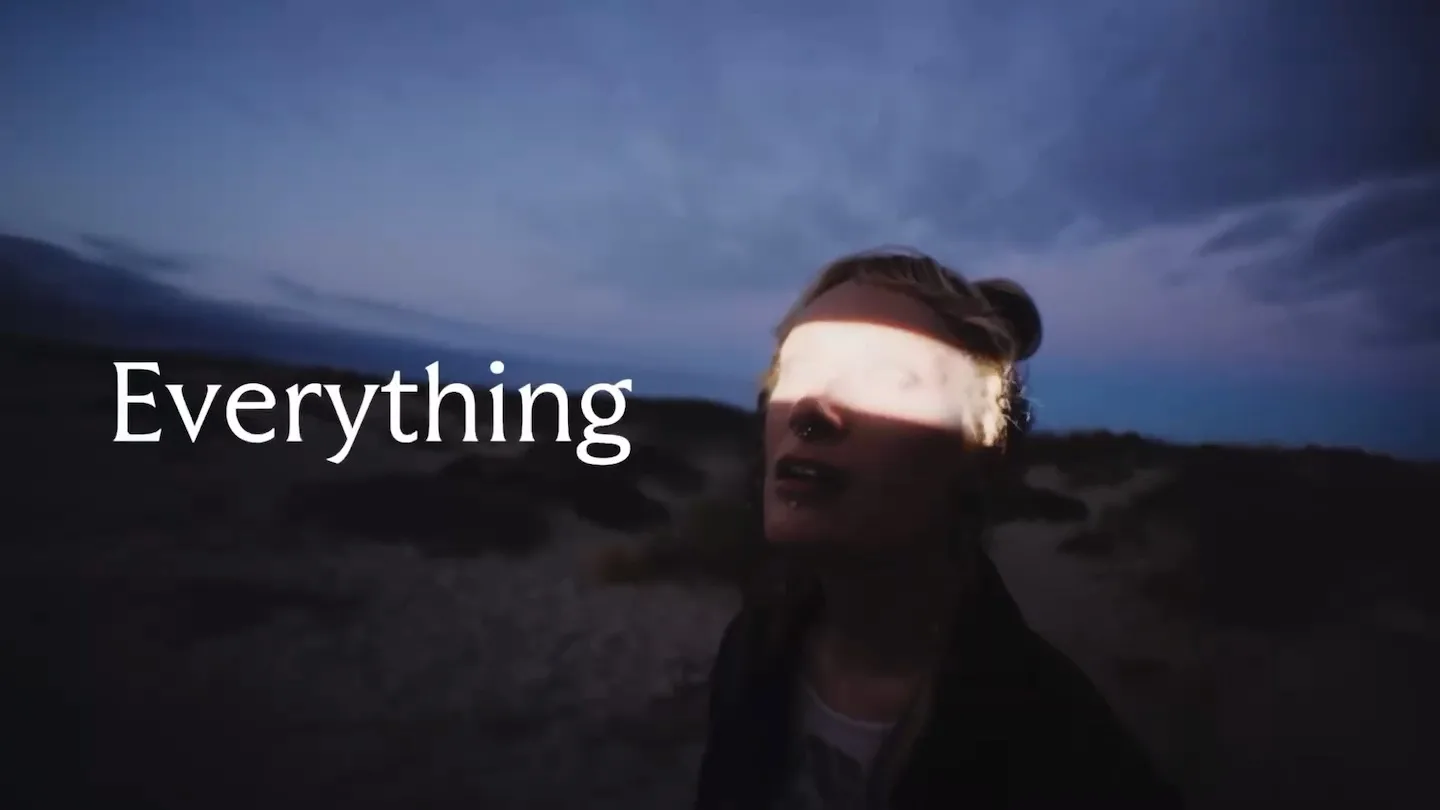
Launch film by Atlas ↗ (2026), the company’s own work.
Credits
- Role
- Lead designer, discovery through definition
- Work
- Initial UX and research, original UI, data visualization, investor pitch deck
- Worked with
- The founder and a small engineering team
- Platform
- iOS app and EEG headband
- Stage
- Seed round
- Launch film
- Atlas, 2026
The brain motion on this page is presentation over the original anatomical design, not measured activity. The storyboards are my own, drawn during discovery as scenarios, not outcomes.